Election 2020: Is What We Watch How We'll Vote?
Online Video Playback & Engagement Analysis
According to a recent analysis of online video playback and engagement data organized in a new Data Dashboard we launched earlier in September, there are striking contrasts in what and how people are watching online that offer hints at underlying voter preferences. Our analysis discovered that Donald Trump has been featured in online video content more than three times as often than Joe Biden in recent months (see Fig 1), resulting in viewers seeing Trump in videos three times as often as his opponent (Fig 2). This incongruent level of exposure may not necessarily translate to building viewer affinity however, as online audiences were 10% more likely to complete watching videos featuring Biden than those featuring Trump (Fig 3) — an indicator that viewers may be more interested or engaged in following news about Biden’s campaign.
Much can be learned from the data of this universe of online video consumption, especially relating to the 2020 Election. Unlike poll data, which probes specifically for voter opinions, or social media likes and shares, which assign value to videos based on cognitive user actions, video content playback data reveals the true subconscious interests of a world online. We watch what we like or what piques our interests. We view what’s most interesting in its entirety, in full screen and with the sound turned on.
This information matters because in these crucial last few weeks before the 2020 election, the race for the presidency is very much a race for exposure. 25% of Americans claim to get their political news primarily from an online website or app, making online video — streamed on digital video players appearing on these websites — both a major source of information and a primary tactic both candidates are using to reach, inform and persuade as many voters as possible.
In AnyClip’s analysis, the company aggregated the playback data of a sample of more than 250 publishers using AnyClip’s Luminous Video Platform to stream video about the election to millions of online viewers. AnyClip analyzed the data of this content consumption to track view, completion and engagement metrics for videos featuring either Trump or Biden and/or other topics relevant to the election, over time. To extrapolate trends, the company selected common keywords relevant to this year’s election, which we also grouped into themes (see Methodology below for details). This data was then loaded into an interactive data dashboard, for further analysis and tracking.
AnyClip hopes that sharing this informational resource will ultimately help voters to better understand the origins and realities of the corpus of news and information available online today and promote a stronger and more informed democratic process in the weeks leading into Election Day 2020. “As a video technology company, we have a unique perspective into not only what online viewers are watching and engaging with, but also a holistic and neutral view into the very content entering into the public distribution pipeline,” says AnyClip President and CEO, Gil Becker. “While we remain strictly nonpartisan in our ability to service both the conservative and liberal ends of the online media spectrum (and everything in between), we believe it’s timely and important to promote access to this information as a means for supporting better journalism.”
Only time can tell which candidate will win the 2020 Presidential Election. But as the nation and the world continue to follow the latest from Donald Trump and Joe Biden leading into Election Day, the data of our collective video viewing reveals not only discrepancies in the candidates’ respective visibility in our measured sample of websites but also signals that may indicate a Biden-leaning preference among online video viewers.
Two important factors to keep in mind when considering these differences are one, the visibility advantages Trump receives as an acting president, and two, the volume of “negative news” published by the media about Trump, in particular. Both of these factors may contribute not only to the quantity of content being published about Trump specifically, but also to viewers’ relative lack of desire to complete videos about him. While it may be true that some viewers do not complete videos featuring Trump because of a general preference for Biden, a higher saturation of Trump-related content in the media may also trigger more frequent viewer disconnect. At this same time, Biden may also be doing a better job at keeping viewers’ attention in recent weeks due to the fact that his platform is more focused more-personal issues such as healthcare, abortion, education and civil rights -- topics validated by this study to hold viewer attention better than others (Fig 4).
As viewers’ topical interest continues to fluctuate dramatically, and with millions of voters still undecided, it is both interesting and critical to continue to monitor these consumption trends to better understand what we’re generally consuming about the election -- and how this information is reaching us.
OTHER KEY FINDINGS
The following are topline findings from AnyClip’s Data Dashboard, observed within the measured sample of 281 websites:
- Biden’s online video visibility problem worsened after the Republican National Convention that took place August 24--27, 2020 (Fig 5). Even though media organizations published 50% more videos featuring Biden in the third week of September than they did in the third week in August, online audiences watched 639% fewer videos featuring the candidate in the third week of September versus the same time in August. Conversely, in this same time period, media organizations published 44% more videos featuring Trump in the third week in September, a similar increase in content volume as Biden, but viewership for Trump only only declined 11% month over month.
- Viewers engage more deeply with videos about the election when Trump or Biden are featured in the content. Between June 21 and September 20, audiences were 55% more likely to complete a video focused on a topic relevant to the election when it also featured Trump and/or Biden within the content (Fig 6).
- Audiences consume content differently and in varying quantities depending the topic and the candidate featured within the video.
undefinedundefinedundefinedundefined
CHARTS
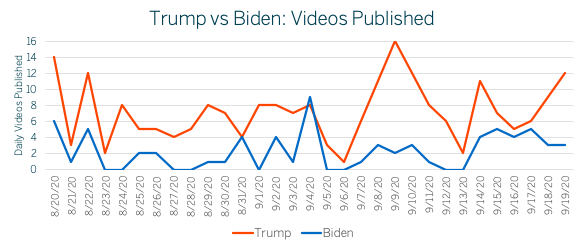
Fig 1: Between August 20 and September 19, media companies published 209 unique videos featuring Trump vs 64 unique videos featuring Biden, a difference of 227%
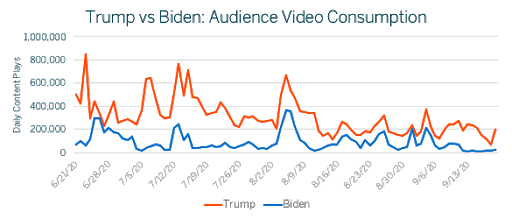
Fig 2. Between June 21 and September 20, content featuring Trump received 27.9MM views,-- 235% more than Biden, who was featured in 8.3MM content plays.
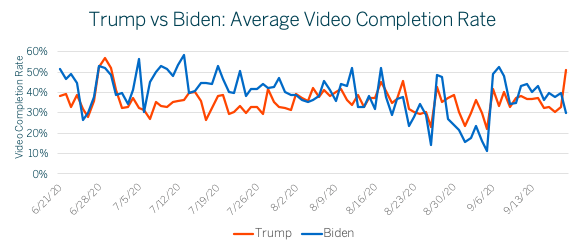
Fig 3: Between June 21 and September 20, viewers completed videos featuring Biden on average 39% of the time, while they completed videos featuring Trump 36% of the time, a difference of 10%.
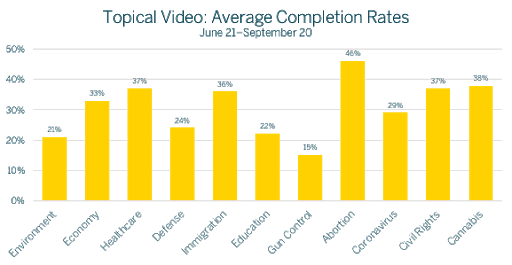
Fig 4: Viewers were most likely to complete watching a video about Abortion, Cannabis, Civil Rights, Healthcare, Immigration and the Economy between June 21 and September 20. .
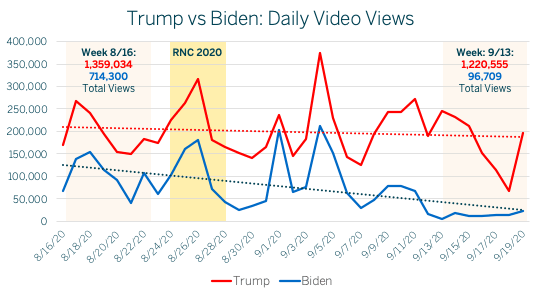
Fig 5: Audiences watched 639% fewer videos featuring Biden the third week in September vs the same time in August.
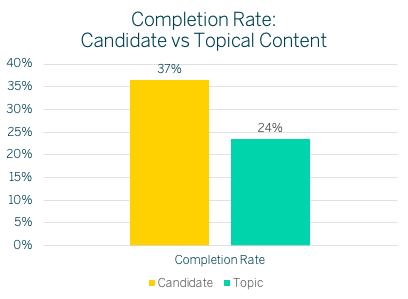
Fig. 6: Audiences were 55% more likely to complete watching a video about an election theme when Trump or Biden were also featured within the content.
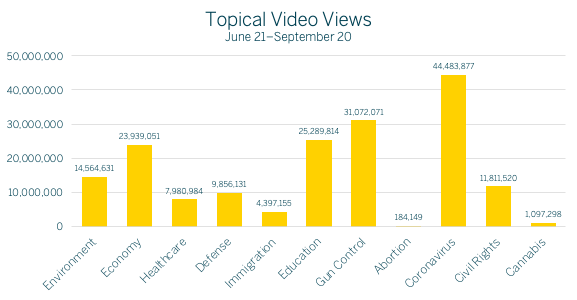
Fig. 7. Audiences generally watched videos about Coronavirus and Gun Control more than any other topic relevant to the election.
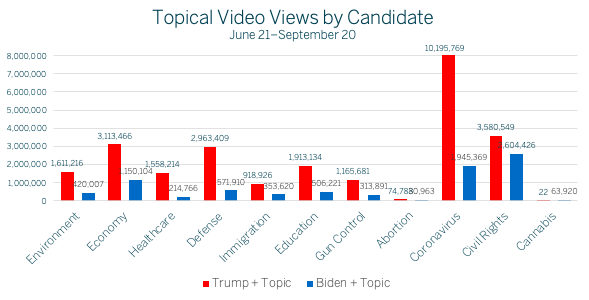
Fig. 8. Audiences watched topical video content differently when it featured either Trump or Biden.
METHODOLOGY
This study leverages AnyClip’s Luminous Video Platform’s video content analysis engine, a patented AI and machine learning technology that analyzes and organizes the true contents of a video’s image and audio contents frame by frame.
In this sample, AnyClip measured the streaming video activity of 281 online media companies using AnyClip’s Luminous Platform to manage and deliver their digital video business to viewers. Each video streamed in this period was first analyzed and automatically “tagged” by the Luminous Engine as it recognized known keywords, people, brands, actions and content categories within each frame of the content. This dataset was then layered on top of the aggregated playback and engagement activity observed by the sample participants. While other topics of video were streamed by these sites, in this study we exclusively focused on playback activity for video content known to be about Donald Trump, Joe Biden and topics known to be relevant to the 2020 presidential election. For each keyword, AnyClip looked at quantity and engagement metrics (views and completions), to make assessments about prominence versus relative importance.
- Completion Rate is calculated as the total number of completed plays divided by the total number of video plays.
- The Luminous Video Platform maintains a library of over 5MM video clips across a range of topics (including political news), and services the video playback for several hundred digital properties each month.
The categories and keywords, brands, terms etc in our analysis are as follows:
Coronavirus
Education
Abortion
Environment
COVID
Coronavirus
COVID-19
Mis-C
SARS-CoV-2
Schools
College
Universities
Students
Parents
Charter Schools
Teachers
Learning
Abortion
Roe
Wade
Pro-Life
Pro-Choice
Planned Parenthood
Reproductive Rights
Global Warming
Emissions
Pollution
Drilling
Fracking
Coal
Energy
Recycling
Climate Change
Wind Power
Oil
Hydroelectric
Green New Deal
Clean Energy