
Tips & Tricks – Covering the Crisis: Tracking Audience Information Needs with Luminous Data
As the Coronavirus pandemic escalates and more communities go into isolation, are audiences consuming more online content than usual?
Using AnyClip’s Luminous Platform data as our guide, we traced video content playback trends from over 350 global media companies using AnyClip video players over the last 90 days to understand what impact Coronavirus-related isolation is having on online traffic.
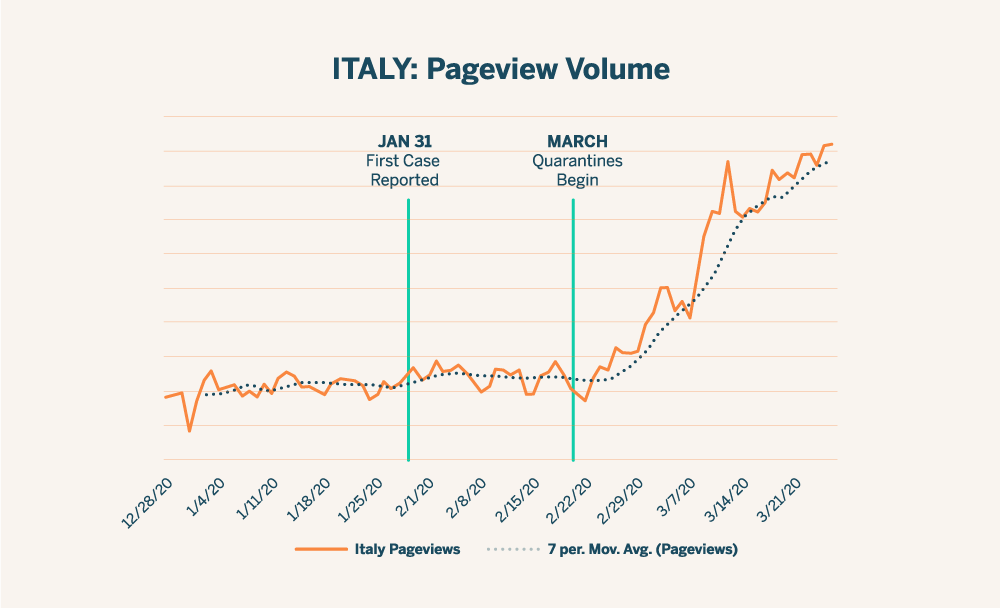
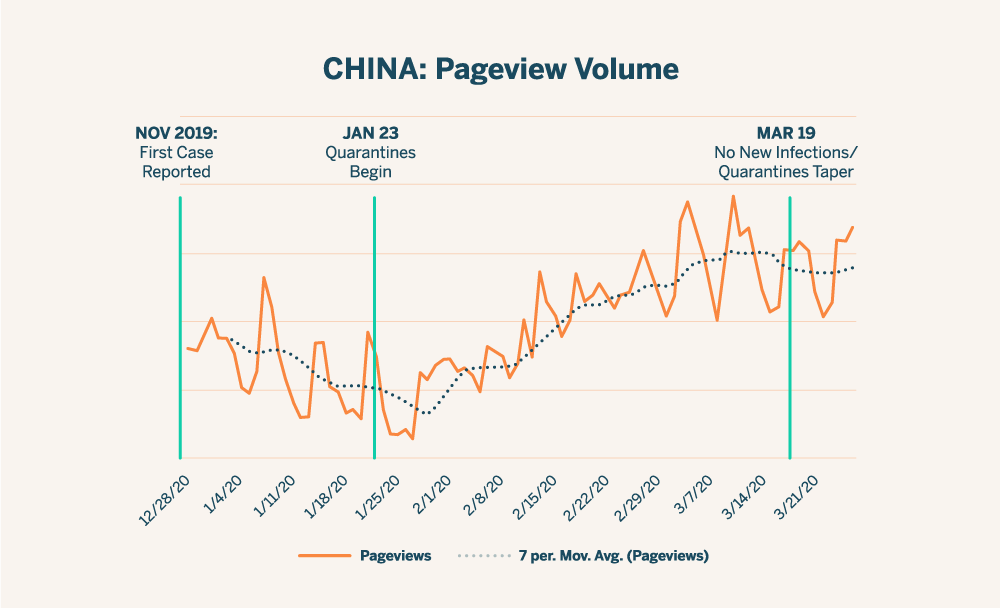
The results are staggering: as preparation activity intensifies and isolation phases begin, online page views surge as global audiences turn to the internet for information about the Coronavirus (COVID-19) outbreak.
Graph: Pageview volume in Italy, 12/26/19—3/24/20
Graph: Pageview volume in China, 12/26/19—3/24/20
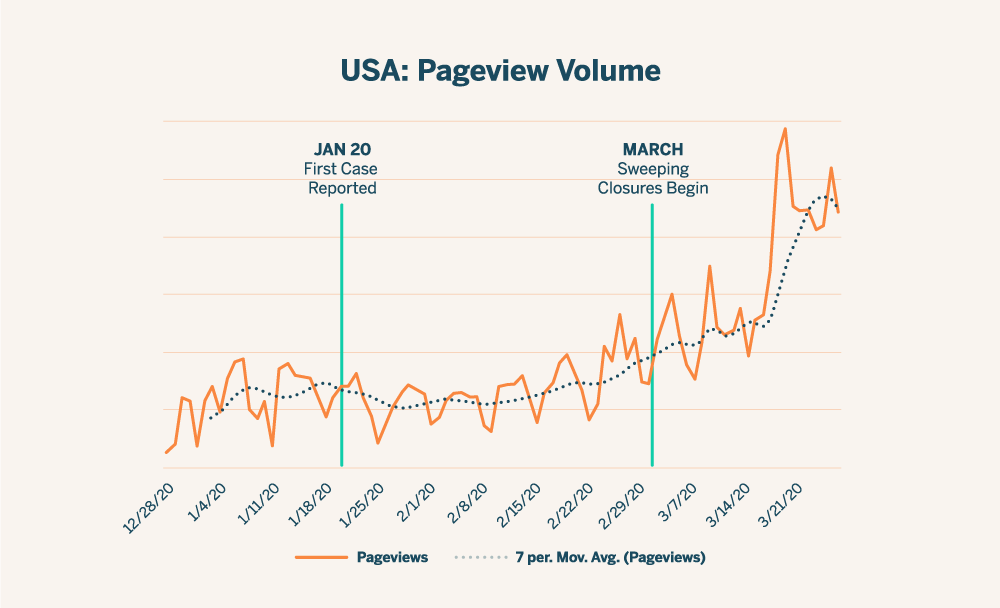
What does this mean? With more lock-downs looming in the days ahead,
US online traffic is expected to rise sharply in the coming weeks.
Graph: Page view volume in the United States, 12/26/19—3/24/20
Source: AnyClip global player load data, 12/26/19—3/24/20;
Virus date information Wikipedia, “2019-20 Coronavirus Pandemic,” 2020.
With traffic expected to rise in the coming weeks, what are the audience interests driving these traffic increases and how can publishers and journalists covering the outbreak better serve their readers’ needs?
We recently launched an interactive Data Dashboard to help publishers and journalists covering the outbreak to answer these questions. Powered by Luminous playback data and updated in real-time, the Dashboard reveals shifting trends in audience information needs as the crisis unfolds.
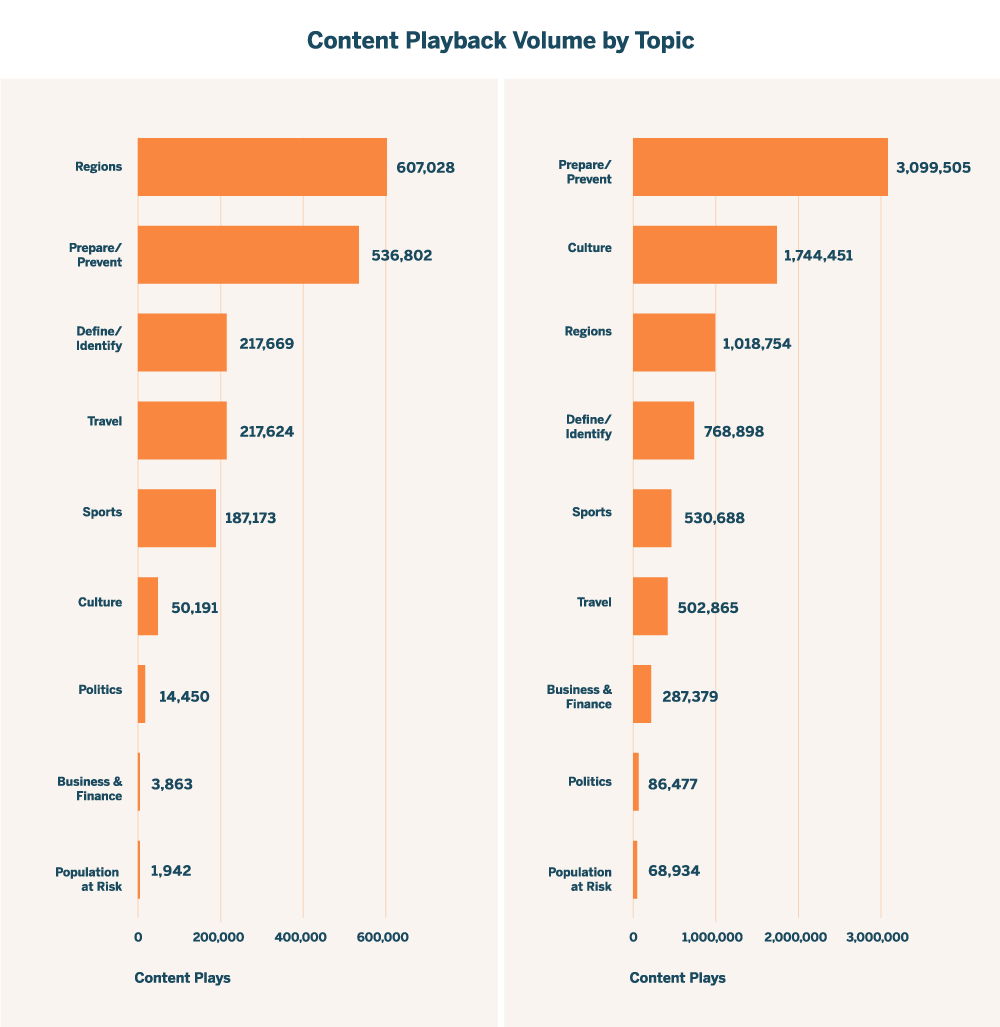
Highlights of our recent findings show that audiences are increasingly interested in consuming content about preparation/prevention in the weeks since the outbreak intensified in North America.
In the first week of March, for example, audiences were most interested in watching news about affected regions such as Italy and Iran (607,028 streams). Later in the month, as the outbreak intensified in North America, interests shifted to preparation and prevention (3,099,505 streams in the last week of March) — a 4X increase in activity.
Chart: Content playback volume by topic, March 3-10 vs March 17-24, 2020
Additionally, as the outbreak intensified during this time period, politics dramatically outpaced all other categories for unmute/full screen engagements as people shifted focus from business and finance concerns in the beginning of the month (11.31%) to seeking government relief at the end of the month (59.65%):
Content Engagement Rate by Topic, March 3-10 vs March 17-24, 2020
These are just sampling of the insights available now through this free online resource.
If your site is actively reporting on the Coronavirus (COVID-19) pandemic, custom dashboards visualizing your own site’s data — or unique pulls of aggregated data — are available. Please get in touch with our team today to discuss your needs…we’re here to help.